Retirement Strategy Group has a New Website!
You may have noticed that we recently made some changes to our website, or maybe you don’t pay close attention to something as mundane as your financial advisor’s website. Either way, here is what we have changed so far and what you can expect going forward.
What is the same?
Actually, not much has changed. Our website can still be found at https://www.rsgutah.com/, and it still contains most of the information and links that you may have used from our old website. Don’t worry, the account access links are still alive and well at the top of our homepage. The majority of the changes were made to modernize and streamline the design, but if you find yourself missing anything from our old site, please don’t hesitate to tell us!
What is different?
As part of this change, we have also decided to update our weekly emails and Facebook posts. The weekly videos and articles that used to be sent out via email and posted on our Facebook site can now be seen on the “Blog” tab of our new website. In their place, we will be sending out and posting a quarterly newsletter (of which this is the first). Our hope is that this newsletter will be more personal, topical, and relevant. You can also find our newsletters, as well as the videos and articles you’re used to, on the “Blog” tab of our new website.
Something useful
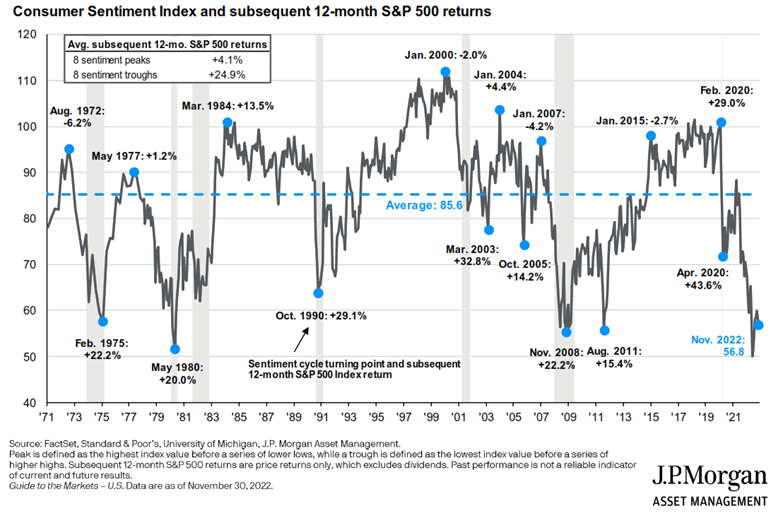
With that housekeeping out of the way, I would also like to present something pertinent to the current investment climate. This quarter, we’d like to discuss the Consumer Sentiment Index.
The Consumer Sentiment Index, as tracked by the University of Michigan, tracks consumer confidence in the US based on surveys to random samples of US households each month. This survey attempts to track attitudes around personal finances, business conditions, and other topics. Essentially, the survey asks, “how do you feel about the economy right now?” As you would expect, the index historically shows pessimism during recessionary periods and increased confidence during economic expansions.
The graph below looks at S&P 500 performance after peaks and troughs in the Consumer Sentiment Index. Interestingly, troughs in sentiment tend to precede stellar equity returns while peaks in sentiment don't see as much upside. This underscores that investing when people are feeling good and getting out of the market when people feel crummy is a poor investment strategy.
For example, when the Consumer Sentiment Index bottomed out in October 1990, the S&P 500 grew 29.1% in the following 12 months. Conversely, when the Consumer Sentiment Index peaked in January of 2000, the next 12 months brought a 2.0% loss. This trend can be seen throughout the Consumer Sentiment Index’s 50-year history.
The blue dot on the far right represents the index as of November 2022. You can see that consumer confidence reversed course in June of this year and has risen significantly in the months since. If history is any guide, this trough could be a good sign for market performance over the next 12 months, and an indicator that it may not be the best time to exit the market.